Home Runs and History
Baseball is a menagerie of numbers and statistical data. For the storied history of the sport, information has been integral to the game of baseball. This storied history is important to note—especially when considering how data can be used to manipulate reality. Critical analysis of these figures and charts must be used to understand the truth behind the numbers.
ERAs Tour
Baseball is all numbers and that’s why fans love it. Each position has its own set of statistics that speaks to on-field production. Using sonar technologies, players and coaches can compile data to understand how well the team is doing.
What’s the Science?
Trackman is a sonar tracking system that is used in baseball to gather statistical data called “sabermetrics.” Capturing these sabermetrics can aid in forecasting results. Sabermetrics make predictions based on previous data, analyze on-field performance by recording important aspects of play, and offer objective insights to assist in decision-making about players’ performance, matchups, and scouting prospects. These metrics are used to make a winning baseball team.

Batting average and on-base percentage are key figures used to evaluate a batter’s performance.
A player’s batting average is calculated by dividing the number of hits they get by their total number of at-bats. For example, if a player gets 30 hits in 100 at-bats, their batting average is .30.
On-base percentage, on the other hand, includes not only hits but also walks and times being hit by a pitch. The number of times a player reaches base is then divided by the total number of plate appearances. This gives a better idea of how often a player reaches base, not just through hitting, but also by other means.
For pitchers, key stats include earned run average (ERA) and strikeouts.
ERA measures how many earned runs a pitcher gives up over nine innings of work. It’s calculated by dividing the total earned runs by the total innings pitched and then multiplying by 9. A lower ERA means the pitcher is doing a good job of keeping runs from scoring.
Strikeouts are the number of times a pitcher gets a batter out by throwing three strikes. This means the batter doesn’t make contact with the ball. More strikeouts generally indicate a pitcher’s ability to overpower hitters.
Defensive stats, like fielding percentage, also play a role. Fielding percentage is calculated by adding up the number of putouts and assists a player makes and dividing that by the total number of chances they had to make a play (which includes putouts, assists, and errors). A higher fielding percentage means a player is good at making plays and avoiding mistakes.
These stats, along with others, help coaches, players, and fans evaluate performance and understand who is contributing to the team’s success in different ways.
Slugger Stories
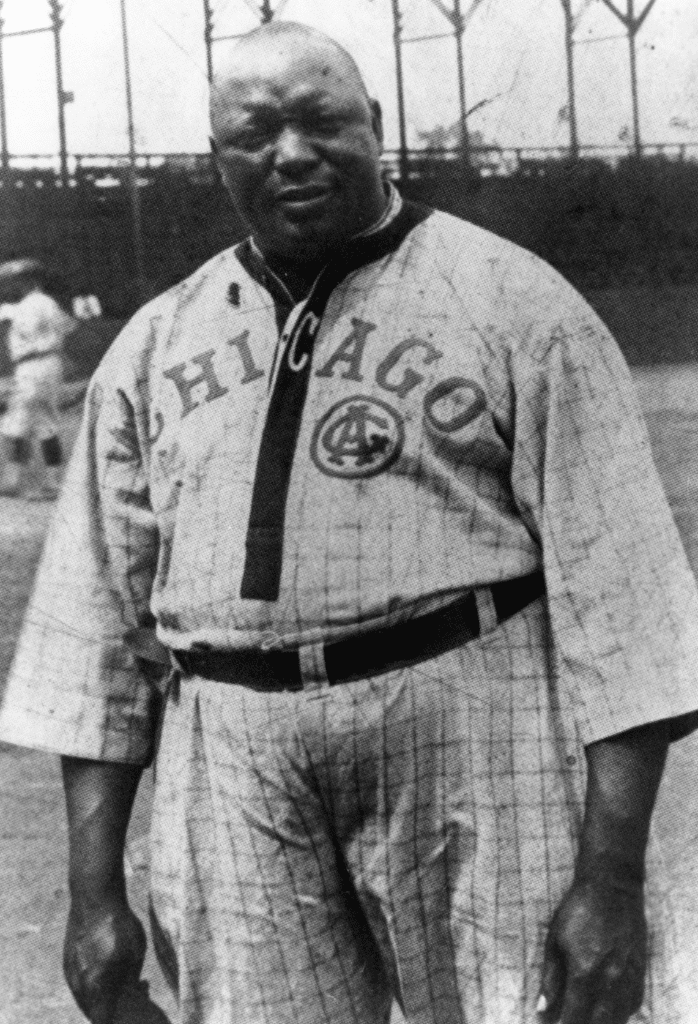
The Negro Leagues were a series of professional baseball leagues in the United States that provided opportunities for Black players to showcase their talents during a time when Major League Baseball was segregated. Many operations for Black athletes were started from the late 1800s onward, The Negro National League being the most successful. Founded in 1920 by Rube Foster, this league was the first successful and long-lasting company, laying the foundation for the future.
The Negro Leagues featured many exceptional players who were excluded from Major League Baseball due to racial segregation. Stars like Satchel Paige and Josh Gibson became legends within the Negro Leagues, showcasing remarkable talent and athleticism. These leagues not only provided a platform for Black players but also became vital to the Black community, fostering a sense of pride and identity through sports.
The integration of Major League Baseball began with Jackie Robinson breaking the color barrier in 1947, leading to the eventual decline of the Negro Leagues. By the early 1960s, the leagues had largely folded, as more Black players joined the Major Leagues. Despite their end, the legacy of the Negro Leagues is celebrated for its contributions to the sport and its role in the fight for racial equality. In recent years, there has been increased recognition and appreciation of the talent and impact of Negro League players with efforts to honor their achievements and preserve their history.

Image Courtesy of The National Baseball Hall of Fame and Museum
In 2024, the MLB integrated player data and statistics from the Negro League into their data set, placing some of the Negro League players at the top of the charts as the greatest players of all time.
Player Profiles

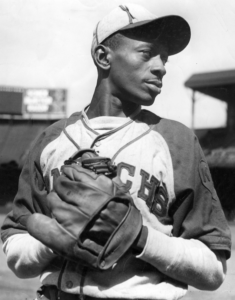
Born in 1907, Leroy Robert “Satchel” Paige had a long and storied pitching career in both the Negro Leagues and Major League Baseball. He started his career in the 1920s with the Birmingham Black Barons and continued on to NLB’s Pittsburgh Crawfords and Kansas City Monarchs in the 1930s. Paige was allowed to join the Major Leagues in 1948, playing for the Cleveland Indians and winning the World Series the same year. He was the oldest rookie in MLB history at age 42. He continued playing baseball into the 60s, eventually winding up for a brief stint with the Portland Beavers. At the end of his professional playing days, he had a career ERA of 2.73 and 1,484 career strikeouts.
Picture Courtesy of the National Baseball Hall of Fame and Museum

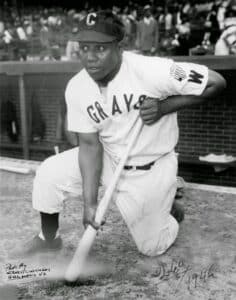
Baseball Hall of Famer Josh Gibson was a shining star of the pre-integration era. He started his career with the Pittsburgh Crawfords, later moving to the Homestead Grays, a Negro League team. Listed as a catcher, he was known to outmatch opposing pitchers with a knack to hit powerful home runs. Gibson touts the highest batting average in Major League Baseball, batting a .372 over 14 seasons. He also holds the single-season record for highest batting average in major league history at .466 in 1943. He recorded 741 home runs over his 17 season career. He is best remembered not for the statistics, but for his larger than life personality. After the integration of NNL data into MLB in 2024, he leapfrogged Babe Ruth for highest on-base plus slugging percentage (OPS).
Picture Courtesy of the Josh Gibson Foundation
Decolonization of Data
In a similar way to information or history, data sets can be skewed or presented in misleading ways. Using baseball statistics from the Negro Leagues and the Major Leagues, we can see how data sets tell stories. When data is completely omitted, it can maintain our preconceived notions of the world- just like many people’s perceptions of Babe Ruth and Josh Gibson.
Data sets are powerful tools used to understand the world around us, but they can sometimes be used in ways that reinforce the power of certain groups. When data is collected, analyzed, or presented by a limited group of people, it can reflect their perspectives, assumptions, and biases. For example, if a data set about education focuses only on certain schools or students from particular backgrounds, it might not tell the whole story. This can lead to incomplete or misleading conclusions that benefit the interests of those who already hold power while leaving out the experiences of others.
In some cases, data can be intentionally skewed to support specific agendas. This is especially true when those in charge of collecting or interpreting the data have a particular goal in mind. For example, a government or corporation might highlight data that makes their actions look good, while ignoring data that shows negative effects on certain groups of people or the environment. By choosing which data to focus on or how to interpret it, these groups can shape public opinion in their favor, creating a version of reality that serves their own interests rather than the truth.
It is important for everyone to be aware of how data is used and to question whether it tells the whole story. Thinkers like Howard Zinn apply a wholistic view of history, taking many different cultural groups into account in order to accurately capture a situation. You can do this too. By including a wide range of voices and perspectives in the creation and analysis of data, we can help ensure that it reflects the experiences of all people, not just those in power. Being critical of how data is presented and who is controlling it can lead to a more fair and accurate understanding of the world, helping to prevent the misuse of data to maintain unfair power structures.
As data technology becomes increasingly prevalent, it is important to acknowledge that there are inherent biases in how it is designed and implemented. For instance, facial recognition software disproportionately misidentifies people of color, a harmful consequence of design choices rooted in biased datasets and perspectives. Such oversights underscore the need for a fundamental shift in how we teach and approach computer and data science.
Reshaping approaches to education involves cultivating self-awareness among future technologists. Encouraging creators to interrogate their own biases and consider the diverse impacts of their work fosters the development of equitable solutions. Questions like “Who benefits from this technology?” and “Who might be harmed or excluded?” must become integral to the design process. Moreover, incorporating diverse perspectives and intercultural experiences can inspire young designers to create technologies that are contextually appropriate and reflective of a pluralistic world. This holistic transformation of education not only equips technologists with technical skills but also instills the moral courage to challenge dominant narratives and build a more just digital future. By addressing human biases at their root, we can transform technology from a tool of oppression into a catalyst for societal progress.
Thanks to our Sponsor
This project is made possible by a grant from Comcast.
